ACCLIMATE Permafrost Thaw Depth Data
2026-04-28
Graphs

This figure shows the distribution of thaw depths from the ground surface to the permafrost by month. Data is summarized from years 2004 to 2025. Red dots indicate 2025 data while the boxes indicate the distribution of data from previous years. On the Y-axis, 0 cm represents the ground surface and increasing depths indicate increasing thaw depths, extending further below the ground surface. In 2025, we saw some of the deeper thaw depths on record, as represented by the red dot falling outside of the boxes in July, August, and September.

This figure shows the change in thaw depth by month over time from 2004 to 2025. In general, thaw depths in May tend to become more shallow over time (with the line trending upwards); however, thaw depths in August and September tend to become deeper over time (with the line trending downwards).
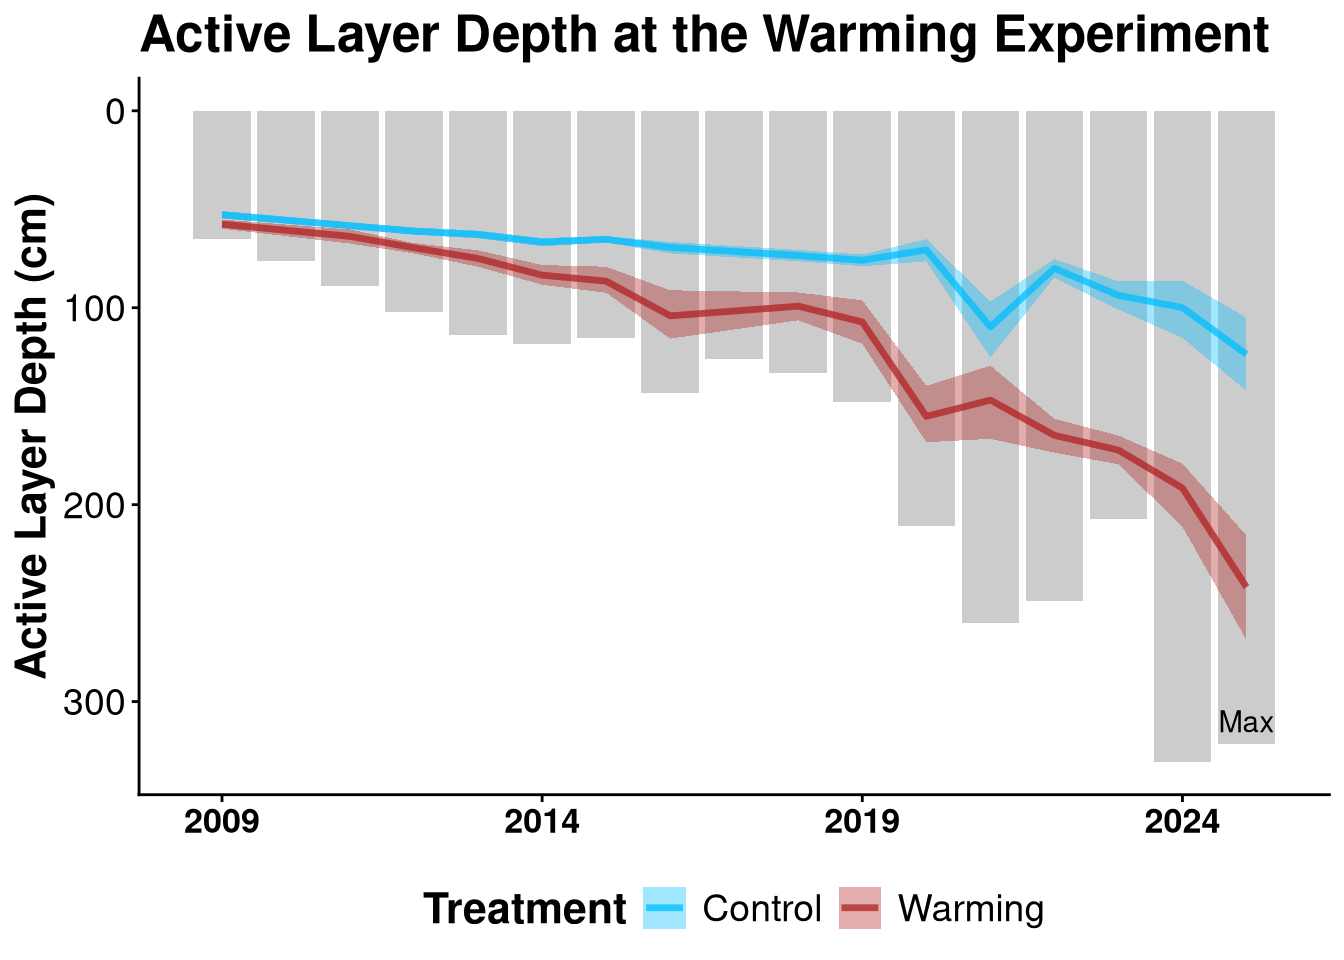
The active layer is the unfrozen layer of surface soil that exists above the permafrost. We measure the active layer at the end of the season, to determine the depth of this soil. On this plot, on the Y-axis, 0 cm represents the ground surface and increasing depths indicate that the active layer is thicker, extending further below the ground surface. Active layer thaw depths at both the control and warming plots are increasing each year. In 2024, we saw the deepest single active layer on record at the Warming Experiment (max) as well as the deepest average active layer depth across all warming plots (mean represented by the red line). In 2025, we observed the second deepest single active layer on record.
Summary Points
- What is it: Thaw depth is a measurement of the distance between the ground surface and the permafrost.
- Non-Scientific name: Depth to permafrost
- Why do we measure it: We measure thaw depth to track how permafrost is thawing across the summer season. Permafrost is soil that is permanently frozen year over year. However, as the climate warms, permafrost is thawing. When this previously frozen ground is thawed, it can then be decomposed by microbes, just like if you were to thaw out vegetables from your freezer. As this soil is decomposed, it releases greenhouse gasses, causing climate change to worsen as greenhouse gas concentrations in the atmosphere rise.
- How was it measured: We measure thaw depth by sticking a thin pole into the ground, through the thawed surface soil, until it hits the solid, frozen permafrost. We measure the amount of thawed, surface soil above the permafrost. This is what is known as “thaw depth”
- Long term trends:
- High and low trends: Thaw depths were shallow in 2009 and progressively became deeper over time in both the control and warming plots. Despite receiving no experimental treatment, the control plot thaw depths continued to deepen over time due to regional warming whereas the warming plots experienced both this regional warming and experimentally applied warming in order to simulate future warming anticipated to occur in the northern hemisphere.
- What happened in 2025: In 2025, we observed the second deepest single active layer on record - surpassed only by 2024.
- Where is this science going?: Measuring thaw depth in the permafrost region is important because, as the climate warms, thaw depths will increase year over year. Increased thaw depths represent increased permafrost degradation over time.
Images

Allison Kelley inserts a thaw depth probe into the ground at one of the submerged plots in Healy, Alaska at the ACCLIMATE site.